CIRCLE of ILLUMINATION SCIENCE EDUCATION
FOR SCHOOL DISTRICTS: High quality professional development and curricular materials specializing in data literacy and data visualization in atmospheric and environmental science.
FOR HOME SCHOOLERS and PARENTS: New!! High quality instructional materials that can help you and your children learn together!
NOTICE and WONDER……

Photo Sheared Mammatus Cloud. Stillwater, Minnesota. October 2019. Copyright Amy Lilienfeld/Circle of Illumination Science Education.
One cannot help but notice and wonder about something like this unusual “sheared mammatus cloud”. But like all clouds it is a phenomenon indicating the incredible things going on in our atmosphere.
What secrets do YOU think this cloud is trying to tell us?
All clouds, in general, are just one element of the highly complex phenomena called “Weather” and “Climate”. Although they operate at vastly different spatial and temporal scales weather and climate are comprised of many of the same elements: air temperature, precipitation, humidity, wind direction and speed, and atmospheric pressure. Each of these elements is constantly changing but also often interacts with some of the other variables in a highly complex system. One of the major goals of Circle of Illumination Science Education is to help unpack some of this complexity while emphasizing the big ideas in a way that all teachers, regardless of prior knowledge, will be able to comprehend.
PROFESSIONAL DEVELOPMENT WEBINARS FALL 2026: Please see webinar offerings below for the start of the new school year 2026, dates and other details to be announced in October. Stay tuned!
INTRODUCING THIRD GRADERS TO REAL-TIME WEATHER DATA and DATA VISUALIZATION with the WATER CYCLE.
(Meets NGSS 3-ESS2-1. Represent data in tables and graphical displays to describe typical weather conditions expected during a particular season (https://www.nextgenscience.org/topic-arrangement/3weather-and-climate)).
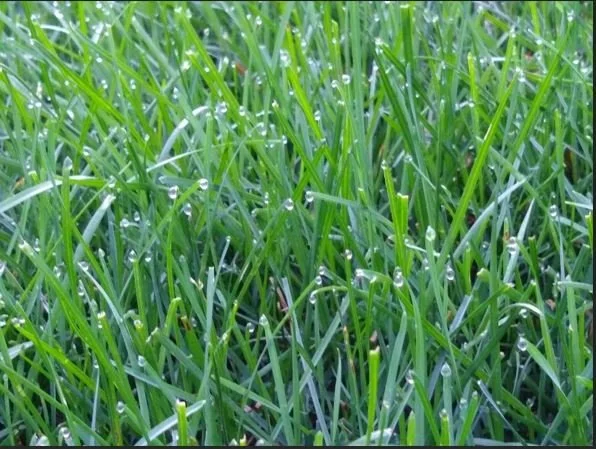
Photo Copyright © Amy Lilienfeld 2020
What better place to start the process of introducing third graders to weather data than with the formation of dew? But dew formation is the result of one of the most important processes in weather: condensation. When air becomes saturated with water vapor, i.e., when relative humidity reaches 100%, condensation will occur. The temperature at which this occurs is called the air’s “dewpoint temperature”. Although at ground level this is associated with the formation— often overnight — of both dew as well as fog at higher altitudes it is associated with the formation of clouds.
In this webinar participants will be introduced to meteograms created by the Wyoming Weather Web (associated with the University of Wyoming Dept. of Atmospheric Science) and the American Meteorological Society. One of the meteograms that will be used will show how when air temperature and dewpoint temperature coincide fog will form.
But what is even more amazing is that this data can be easily downloaded into a form that teachers can understand and make available to their students for the creation of graphs and other data visualization tools!! In this webinar teachers will learn where and how to access this data as well as how to intepret key variables so they can prepare simpler, smaller datasets
INTRODUCING THIRD GRADERS TO REAL-TIME WEATHER DATA and DATA VISUALIZATION with DATA COLLECTION.
(Meets NGSS 3-ESS2-1. Represent data in tables and graphical displays to describe typical weather conditions expected during a particular season (https://www.nextgenscience.org/topic-arrangement/3weather-and-climate)).
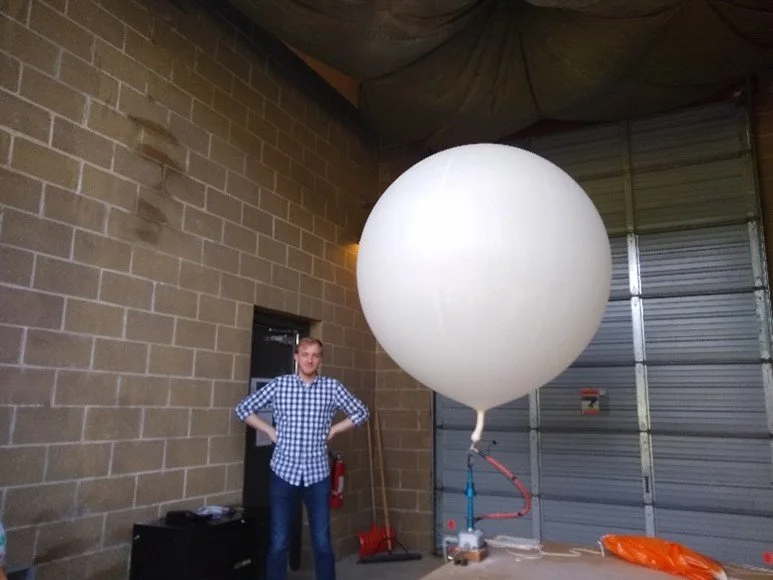
PREPARATION of WEATHER BALLOON, or RADIOSONDE, FOR LAUNCH BY STAFF MEMBER at NWS WEATHER STATION, CHANHASSEN, MINNESOTA. Used with permission.
Although many people are aware that weather data is collected at weather stations across the U.S. fewer people know that data is also collected in the upper atmosphere by weather balloons, or “radiosondes”, as shown in photo above. Such data provides an important cross-section of our atmosphere at a particular point in time. It is pretty amazing that, with the press of a few keys on a keyboard, one can see what the air temperature, relative humidity, atmospheric pressure and wind direction and speed – among other variables-- are at several different altitudes going up as high as over 100,000 feet!!!
Such data helps scientists to identify things such as “wind shear” that can contribute to the development of severe weather such as tornadoes as well as help document atmospheric inversions that can contribute to poor air quality at other times of the year.
But what is even more amazing is that this data can be easily downloaded into a form that teachers can understand and make available to their students for the creation of graphs and other data visualization tools!! In this webinar teachers will learn where and how to access this data as well as how to interpret key variables so they can prepare simpler, smaller datasets that their students can use to make graphs. In addition, it will provide a wonderful opportunity for students to learn more about several important aspects of the nature and practice of science.